Power BI Course in Coimbatore
Master Business Intelligence and Data Visualization with Real-Time Projects
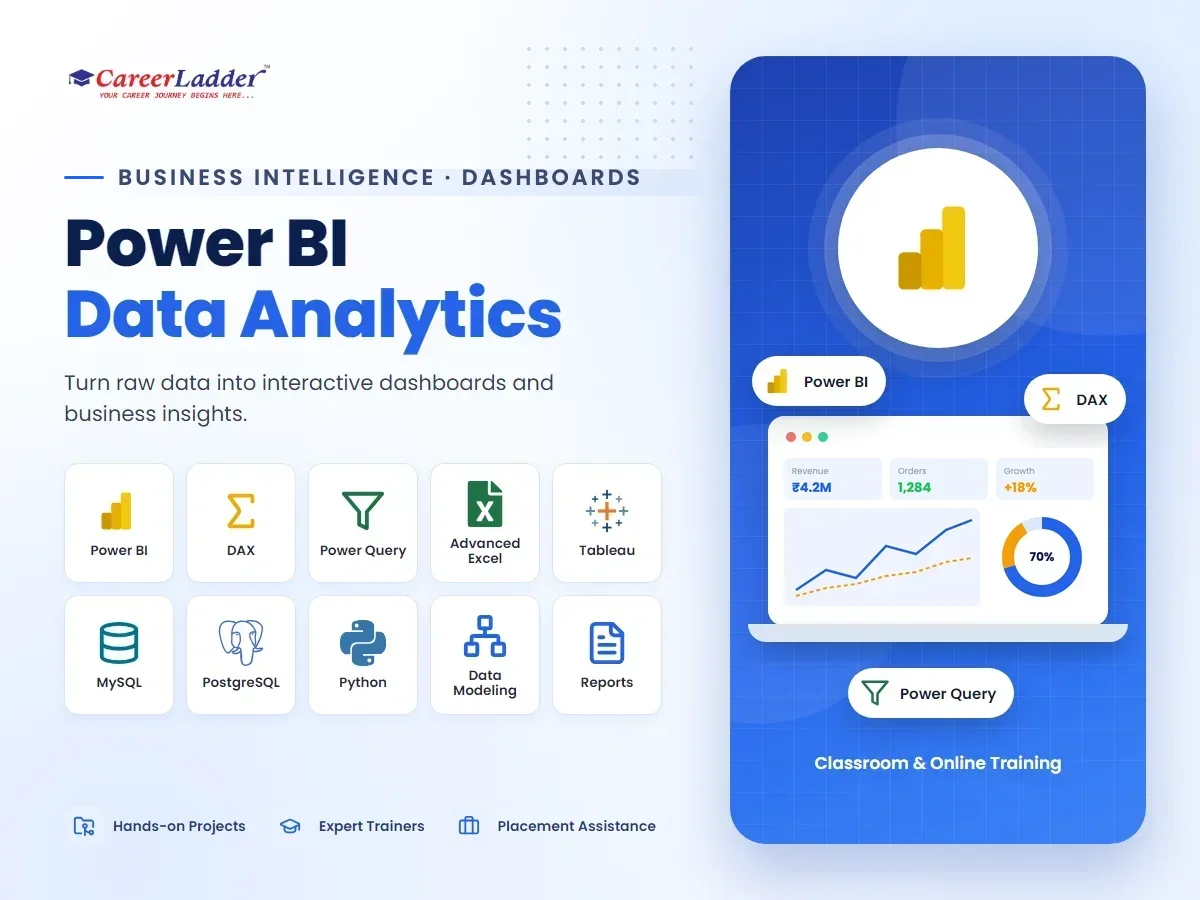
About the Power BI Data Analytics Course
Transform raw data into meaningful insights with Microsoft Power BI, SQL, and Advanced Excel.
Train at our Avinashi Road (Hope College, Peelamedu) or Sundarapuram branch in Coimbatore — or join online — with hands-on projects, industry mentors, and dedicated placement support from day one.
Power BI is Microsoft’s business intelligence platform and, for most Indian companies, the default tool for turning spreadsheets and databases into live dashboards. Because it plugs directly into the Microsoft ecosystem that businesses already run on — Excel, SQL Server, Azure, Teams — Power BI skills show up in a huge share of analyst and reporting job descriptions. This course is a tool-mastery programme: its goal is to make you demonstrably excellent at Power BI, with SQL, Advanced Excel, Tableau, and Python for analytics as supporting skills.
Mastery here means going well beyond dragging charts onto a canvas. You learn Power Query for cleaning and shaping data, proper star-schema data modelling, DAX from first principles through time intelligence, report design that follows visual best practices, and publishing, security, and refresh scheduling in the Power BI Service. These are the exact areas where a certification-level Power BI developer differs from a casual user — and where interviews for BI roles focus.
For Coimbatore learners, Power BI is an especially practical bet. The city’s manufacturing and textile companies are moving their production, inventory, and sales reporting off static Excel sheets; hospitals, retail groups, and finance firms are doing the same; and IT services teams around TIDEL Park Coimbatore and KGISL deliver BI projects for global clients. A focused Power BI skill set makes you employable across all of these without needing a full programming background.
The course runs in classroom mode at Career Ladder’s Hope College (Avinashi Road) and Sundarapuram branches and live online, with identical content either way. Career Ladder has trained 10,000+ students and holds a 4.6-star rating across 1,500+ Google reviews, and placement assistance — resume building, mock interviews, and hiring-partner referrals — is part of the programme.
Course Syllabus
Module-by-module curriculum — expand each to see the topics covered.
Module 1:BI Foundations and Advanced Excel+
- What business intelligence is and how reporting teams work
- Advanced Excel: XLOOKUP, pivot tables, and data cleaning
- Excel charts and dashboard basics
- From Excel to BI tools: when spreadsheets stop scaling
- Understanding KPIs, dimensions, and measures
Module 2:SQL for BI Developers+
- MySQL/PostgreSQL basics: SELECT, WHERE, and sorting
- Joins and combining tables for reporting
- Aggregations, GROUP BY, and views
- Window functions for rankings and running totals
- Writing the queries that feed BI dashboards
Module 3:Power BI Desktop and Power Query+
- Power BI Desktop interface, connecting to Excel, CSV, and databases
- Power Query Editor: shaping, filtering, and merging queries
- Data profiling and fixing quality issues at load time
- Appending sources and parameterised queries
- Introduction to M language concepts
- Query folding and performance-aware transformations
Module 4:Data Modelling in Power BI+
- Star schema: fact and dimension tables
- Relationships, cardinality, and filter direction
- Date tables and why every model needs one
- Handling many-to-many and role-playing dimensions
- Model size and performance basics
Module 5:DAX from Basics to Time Intelligence+
- Calculated columns vs measures
- Core functions: SUM, AVERAGE, COUNTROWS, DIVIDE
- CALCULATE and filter context — the heart of DAX
- Time intelligence: YTD, MTD, same period last year
- Variables, iterators (SUMX, AVERAGEX), and common patterns
- Debugging DAX and reading evaluation context
Module 6:Report Design and Interactive Dashboards+
- Choosing the right visual for each metric
- Slicers, drill-through, tooltips, and bookmarks
- Conditional formatting and KPI cards
- Layout, colour, and accessibility best practices
- Designing executive dashboards vs operational reports
Module 7:Power BI Service, Sharing, and Governance+
- Publishing reports and organising workspaces
- Scheduled refresh and data gateways
- Row-level security for department-wise access
- Sharing via apps, Teams, and embedding basics
- AI visuals and Copilot-style features in Power BI
Module 8:Tableau and Python for Analytics+
- Tableau essentials: worksheets, dashboards, and stories
- How Tableau and Power BI differ and when companies use each
- Python Pandas and NumPy for pre-dashboard data preparation
- Bringing Python-cleaned data into Power BI
- Portfolio project: the same dataset visualised in both tools
Module 9:Capstone and PL-300 Exam Preparation+
- End-to-end capstone: raw data to published, secured dashboard
- Microsoft PL-300 (Power BI Data Analyst) exam blueprint walkthrough
- Practice scenarios and mock questions
- Portfolio publishing and resume alignment for BI roles
- Mock interviews: DAX, modelling, and scenario questions
Who Should Join This Course
Real-World Projects You Will Build
- 1Retail sales and profitability dashboard: model multi-outlet sales data with a proper star schema, DAX profit measures, and drill-through to transaction detail.
- 2Manufacturing production monitor: build a dashboard tracking output, rejection rates, and machine downtime from shop-floor style data — directly relevant to Coimbatore industry.
- 3Finance dashboard with time intelligence: revenue, expenses, and margin with YTD, quarter-over-quarter, and same-period-last-year comparisons.
- 4HR analytics report: headcount, attrition, and hiring-funnel dashboards with row-level security so each department head sees only their data.
- 5Tableau comparison project: rebuild one of your Power BI dashboards in Tableau and document the differences — a strong talking point in BI interviews.
- 6Capstone: take a messy multi-source dataset through Power Query cleanup, modelling, DAX, report design, and publishing with scheduled refresh, then present it as you would to a client.
Career Scope & Opportunities
Power BI skills map to some of the most consistently advertised data roles in India: Power BI Developer, BI Analyst, Data Analyst, Reporting Analyst, and MIS Analyst. Because Power BI is licensed by so many mid-size companies, demand extends far beyond IT firms into manufacturing, healthcare, retail, and finance — which is exactly the employer mix Coimbatore offers.
Freshers entering BI roles in India typically see offers around 3-5 LPA, with certified candidates (PL-300) and strong portfolios trending higher. Experienced Power BI developers with solid DAX and data modelling skills commonly reach 7-12 LPA in the 3-5 year band in the Indian market, and BI consultants at services firms can grow further with client-facing experience. These are hedged market ranges — outcomes depend on your skill depth and interviews.
Locally, BI work comes from three directions: IT services companies around TIDEL Park Coimbatore and KGISL delivering dashboards for overseas clients, large employers such as Cognizant, TCS, and Bosch-linked operations in the region, and Coimbatore’s own manufacturing, textile, and retail businesses digitising their reporting. The tool-specific nature of the skill also makes remote and freelance dashboard work realistic once you have a portfolio.
Career Ladder supports the transition with placement assistance built for BI hiring: resumes structured around dashboards you can demo, mock interviews covering DAX and modelling scenarios, and referrals to hiring partners seeking Power BI skills.
What You Will Master
100% Placement Assistance
Resume building, mock interviews, and direct referrals to our hiring partners — until you land the role.
Frequently Asked Questions
Do I need coding knowledge for Data Analytics?+
Not necessarily. Tools like Power BI, Tableau, and Excel require logical thinking rather than heavy coding. SQL and basic Python are taught from scratch.
What tools are covered in this course?+
We cover Power BI, Tableau, SQL, Advanced Excel, and Python for Data Analysis.
Is placement assistance provided?+
Yes, we provide 100% placement support, including mock interviews and resume building for Data Analyst roles.
How long does the Power BI course take?+
Most students complete it in about 2.5 to 3 months, with weekday and weekend batches. Since it is tool-focused rather than programming-heavy, learners typically build their first dashboard within the first few weeks.
Does this course prepare me for the Microsoft PL-300 certification?+
Yes. The syllabus covers the PL-300 (Power BI Data Analyst) exam areas — preparing data, modelling, visualising, and managing assets — and the final module includes exam-pattern practice. The certification fee is paid separately to Microsoft.
Power BI course or the full Data Analytics course — which should I pick?+
Pick this course if you want deep mastery of Power BI and BI development specifically, with SQL and Excel as support skills. Pick the Data Analytics course if you want broader coverage including more Python and general analyst training. Both lead to analyst roles; this one goes deeper on the tool.
Is this course suitable for complete beginners?+
Yes. It starts from Excel and basic data concepts, and Power BI itself is one of the most beginner-friendly tools in the data field. No programming background is required; SQL and basic Python are taught from scratch within the course.
Can I learn this online, or is classroom attendance required?+
Both modes are available with the same syllabus and projects. You can join classroom batches at our Hope College or Sundarapuram branches in Coimbatore, or attend live online sessions — online learners get the same placement assistance.
Our Coimbatore Branches
Hope College (Peelamedu)
1st Floor, 267, Avinashi Road, Peelamedu (Hope College), Opposite GRG Ladies Hostel, Above Sneha Hospital, Coimbatore 641004
+91 88702 75880
Sundarapuram
1st Floor, Bank of Baroda Building, 5, Madukkarai Main Rd, opp. Abirami Hospital, Sundarapuram, Coimbatore
+91 88070 28071
Related Courses
Data Science with Machine Learning
Dive into Data Science and explore machine learning, big data, and predictive modeling.
AI Powered Data Analytics
Learn how to analyze and interpret data to help businesses make informed decisions.
Artificial Intelligence (Core)
Dive deep into AI concepts such as neural networks, machine learning, and robotics.