Data Analytics Course in Coimbatore
Master SQL, Python, Advanced Excel & Power BI with real-time projects
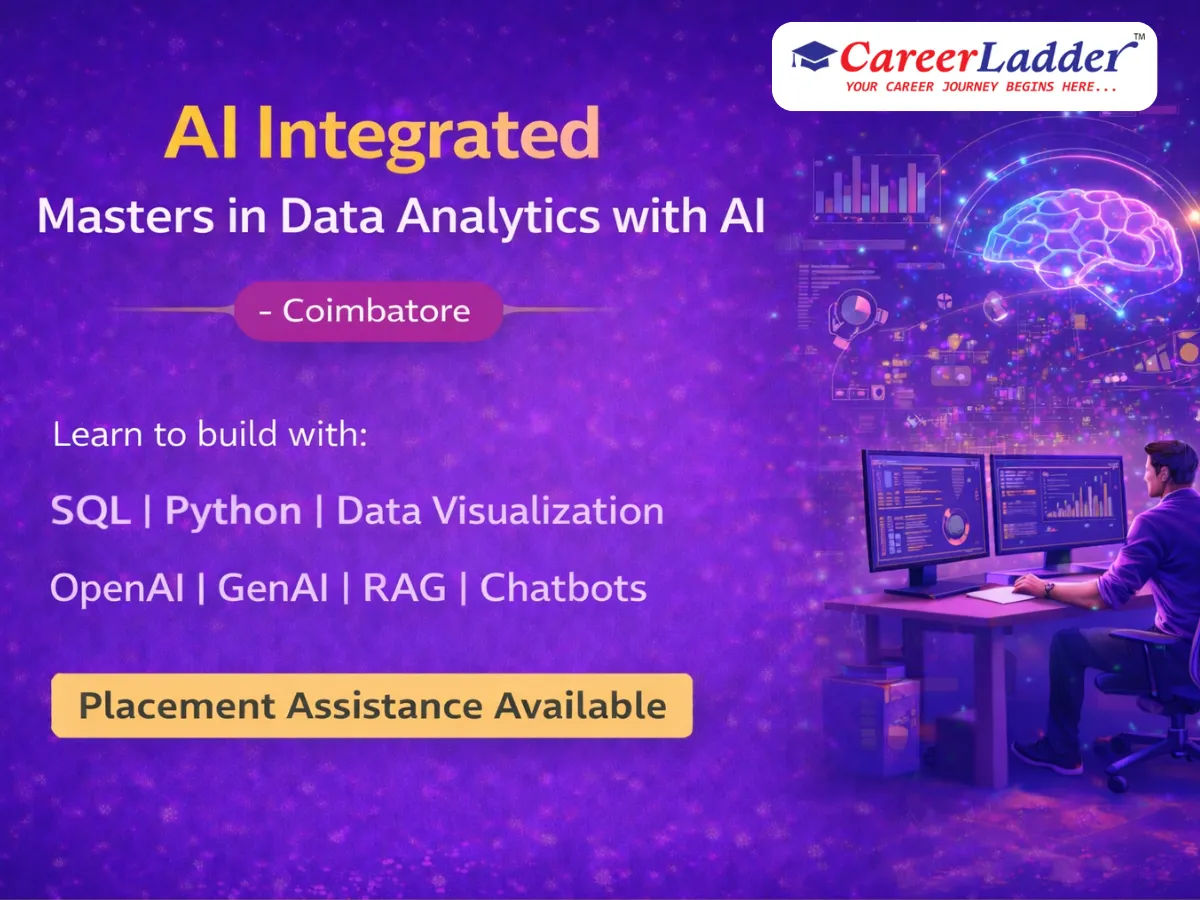
About the AI Powered Data Analytics Course
Learn how to analyze and interpret data to help businesses make informed decisions.
Train at our Avinashi Road (Hope College, Peelamedu) or Sundarapuram branch in Coimbatore — or join online — with hands-on projects, industry mentors, and dedicated placement support from day one.
Every business decision today runs on data — which products to stock, which customers to retain, where marketing money is wasted — and data analysts are the people who turn raw records into those answers. This AI Powered Data Analytics course is built around the four tools that dominate analyst job descriptions in India: SQL for pulling data, Advanced Excel for quick analysis, Python (Pandas and NumPy) for cleaning and automation, and Power BI for dashboards that decision-makers actually read.
The course is business-first by design. Rather than starting with heavy theory, each module is framed around a business question — why did sales dip in Q3, which branch is underperforming, what does customer repeat behaviour look like — and you learn the tool skills needed to answer it. You also learn the newer part of the job: using AI assistants to draft queries, summarise findings, and speed up routine analysis, so your output matches what modern analytics teams expect in 2026.
Coimbatore’s job market suits analysts particularly well because demand is not limited to IT companies. Retail chains, hospitals, NBFCs, logistics firms, and the city’s large manufacturing and textile base all run reporting and MIS functions that are upgrading from plain Excel to SQL-and-BI workflows. Add the services companies around TIDEL Park Coimbatore and KGISL, plus firms like Cognizant and TCS in the region, and analytics becomes one of the widest doorways into a data career locally.
You can attend classroom sessions at Career Ladder’s Hope College (Avinashi Road) or Sundarapuram branches, or take the same programme live online. With 10,000+ students trained and a 4.6-star rating from 1,500+ Google reviews, the institute pairs the training with placement assistance — resume building around your dashboard portfolio, mock interviews with SQL and case questions, and referrals to hiring partners.
Course Syllabus
Module-by-module curriculum — expand each to see the topics covered.
Module 1:Analytics Foundations and Excel Mastery+
- How analytics drives business decisions: KPIs and metrics thinking
- Advanced Excel: lookups (VLOOKUP/XLOOKUP), IF logic, and data cleaning
- Pivot tables, pivot charts, and slicers
- What-if analysis, conditional formatting, and dashboarding in Excel
- Excel shortcuts and productivity patterns analysts use daily
Module 2:Statistics for Analysts+
- Descriptive statistics: mean, median, spread, and percentiles
- Distributions and spotting outliers
- Correlation and simple trend analysis
- Sampling and survey data basics
- A/B test results: reading significance without the jargon
Module 3:SQL from Zero to Job-Ready+
- Databases and tables: SELECT, WHERE, ORDER BY
- Joins across multiple tables and subqueries
- GROUP BY, HAVING, and aggregate functions
- Window functions: RANK, LAG, and running totals
- CASE logic and date handling
- Writing interview-style SQL queries under time pressure
Module 4:Python for Data Analysis+
- Python basics: variables, loops, functions, and lists
- NumPy arrays and numeric operations
- Pandas: reading files, filtering, grouping, and merging
- Data cleaning: missing values, duplicates, and type fixes
- Automating repetitive Excel-style reports with Python
Module 5:Data Visualization with Matplotlib and Power BI+
- Chart selection: when to use bars, lines, and scatter plots
- Matplotlib and Seaborn for quick analytical plots
- Power BI: data import, Power Query transformations, and modelling
- DAX basics: calculated columns and measures
- Designing clean, interactive business dashboards
- Publishing and sharing reports with Power BI Service
Module 6:Exploratory Data Analysis and Business Case Solving+
- Structuring an analysis: from vague question to concrete metrics
- Full EDA workflow on a real business dataset
- Root-cause analysis: drilling from symptom to driver
- Cohort and funnel analysis for customer data
- Writing an insight summary a manager can act on
Module 7:AI-Assisted Analytics Workflows+
- Using ChatGPT-style assistants to draft SQL and Python code safely
- AI features inside Excel and Power BI (Copilot-style workflows)
- Prompting patterns for data summarisation and report drafts
- Verifying AI output: avoiding silent errors in analysis
- Where AI helps analysts and where human judgement stays essential
Module 8:Capstone, Portfolio, and Interview Preparation+
- End-to-end capstone: raw data to dashboard to presentation
- Building a portfolio on GitHub and Power BI
- SQL and case-study mock interviews
- Resume building for analyst job descriptions
- Common analyst interview questions and how panels evaluate answers
Who Should Join This Course
Real-World Projects You Will Build
- 1Sales performance dashboard: model multi-branch retail sales in Power BI with drill-downs by region, product, and month, plus DAX measures for growth and targets.
- 2E-commerce customer analysis: use SQL and Python to compute repeat-purchase rates, average order value, and cohort retention, then present recommendations.
- 3HR attrition analysis: explore employee data in Pandas to identify which departments and profiles show highest attrition, visualised for an HR-head audience.
- 4Marketing campaign ROI report: combine spend and conversion data in Excel and Power BI to identify which channels actually pay back.
- 5Inventory and supply analysis for a manufacturing-style dataset: track stock ageing, reorder patterns, and supplier delays — the kind of problem Coimbatore firms hire analysts to solve.
- 6Capstone: a complete business case where you receive messy raw data, define the metrics, clean and model the data, and defend your insights in a mock stakeholder review.
Career Scope & Opportunities
Data analyst is one of the highest-volume digital job titles in India, because every function — sales, finance, operations, marketing, HR — needs someone who can query data and present it clearly. Entry designations include Data Analyst, Business Analyst, MIS Analyst, Reporting Analyst, and Analytics Executive, with growth paths into senior analyst, analytics consultant, or onward into data science and data engineering.
Fresher salaries for analyst roles in India typically fall around 3-5 LPA, with strong SQL skills and a solid dashboard portfolio pushing candidates toward the top of that band. With 2-4 years of experience, 6-10 LPA is a common market range, and domain-plus-analytics combinations (finance analytics, supply-chain analytics) often command a premium. Treat these as indicative Indian market ranges rather than promises.
In Coimbatore specifically, analyst hiring spans IT services teams around TIDEL Park Coimbatore and KGISL, the offices of large firms such as Cognizant and TCS in the region, and — importantly — non-IT employers: textile and manufacturing groups digitising operations, hospitals, retail chains, and NBFCs building reporting teams. The city’s growing SaaS and startup scene also hires analysts early, since young companies need reporting before they need data scientists. Remote and hybrid analyst roles further widen your options.
Placement assistance at Career Ladder mirrors the actual hiring funnel for analysts: a resume built around measurable project outcomes, repeated mock interviews covering SQL tests and business case rounds, and referrals to hiring partners when you are interview-ready.
What You Will Master
100% Placement Assistance
Resume building, mock interviews, and direct referrals to our hiring partners — until you land the role.
Frequently Asked Questions
Do I need a specific degree for Data Analytics?+
No, graduates from any discipline can join. We cover all the required fundamentals, including statistics and programming basics.
What tools will I learn?+
You will master essential data analytics tools including Python, SQL, Power BI, and Advanced Excel.
Is this course practical?+
Yes, the course is heavily project-based. You will build multiple real-world dashboards and data models to solve business problems.
How long is the Data Analytics course?+
The programme typically takes around 3 to 4 months to complete, with weekday and weekend batch options. Working professionals can comfortably manage it alongside a full-time job.
Should I choose Data Analytics or Data Science?+
Choose Data Analytics if you want a faster, business-facing route into data jobs using SQL, Excel, Python, and Power BI. Choose Data Science if you want deeper statistics and machine learning for modelling roles. Many students start with analytics, get placed, and upgrade to data science later.
Is the course available online, or do I have to attend in person?+
Both options are available. You can attend classroom sessions at our Hope College or Sundarapuram branches in Coimbatore, or join the same live sessions online with identical content, projects, and placement assistance.
What jobs can I apply for after completing this course?+
You can apply for Data Analyst, Business Analyst, MIS Analyst, and Reporting Analyst roles. These positions exist across IT companies, banks, retail, healthcare, and manufacturing firms, so you are not limited to the software industry.
Do I get a certificate, and does it help in getting a job?+
Yes, you receive a Career Ladder completion certificate. That said, recruiters shortlist analysts based on demonstrable SQL skills and dashboard portfolios, which is why the course is built around projects you can show in interviews.
Our Coimbatore Branches
Hope College (Peelamedu)
1st Floor, 267, Avinashi Road, Opposite GRG Ladies Hostel, Above Sneha Hospital, Hope College, Coimbatore 641004
+91 88702 75880
Sundarapuram
1st Floor, Bank of Baroda Building, 5, Madukkarai Main Rd, opp. Abirami Hospital, Sundarapuram, Coimbatore
+91 88070 28071
Guides From Our Blog
How to Become a Data Analyst in Coimbatore: 2026 Roadmap
A practical 2026 roadmap to become a data analyst in Coimbatore: skills to learn (SQL, Excel, Power BI, Python), timelines, local job market and course tips.
Read the guide →Data Science Course Fees in Coimbatore: What You Should Expect to Pay in 2026
Honest guide to data science course fees in Coimbatore for 2026: typical market price ranges, what drives cost, red flags to avoid and questions to ask before paying.
Read the guide →How to Choose a Software Training Institute in Coimbatore
A practical 2026 checklist for choosing a software training institute in Coimbatore: trainers, syllabus, placement claims, demo classes, reviews and location — and the red flags to avoid.
Read the guide →Related Courses
Data Science with Machine Learning
Dive into Data Science and explore machine learning, big data, and predictive modeling.
Power BI Data Analytics
Transform raw data into meaningful insights with Microsoft Power BI, SQL, and Advanced Excel.
Artificial Intelligence (Core)
Dive deep into AI concepts such as neural networks, machine learning, and robotics.